Short answer: for statistical forecasting you need at least 24 months of sales history per item. Two years is the minimum for a model to tell seasonality apart from trend. With 12 months you can see the level and perhaps a trend, but seasonality has to come from business knowledge. Three to five years is better for stable products, as long as the older data still reflects how the product sells today. History is only part of it: you also need the events that shaped it, such as promotions, stockouts and price changes, or the model learns the wrong lessons.
Data requirements for forecasting
We are often asked what the minimum data for forecasting is. It’s an important question, because the forecast can only be as good as the data that goes in. Most demand forecasting uses time-series methods, which learn patterns from an item’s own history, so the length and quality of that history largely decide how accurate the forecast can be. Let’s look at what each length of history lets a forecast see.
One month of history
Say we have only one month of sales. What will the forecast look like?
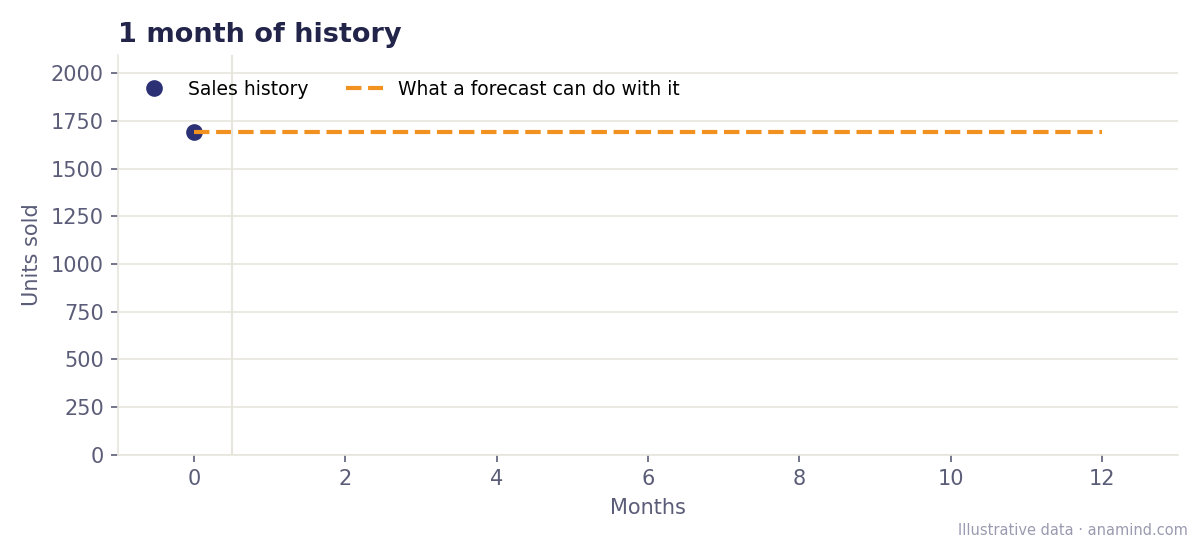
With a single data point there is no pattern to find: no trend and no seasonality. The forecast is a straight line equal to last month’s sales, which is a naive forecast.
Three months of history
What if we add two more months, so we have three months of sales data?
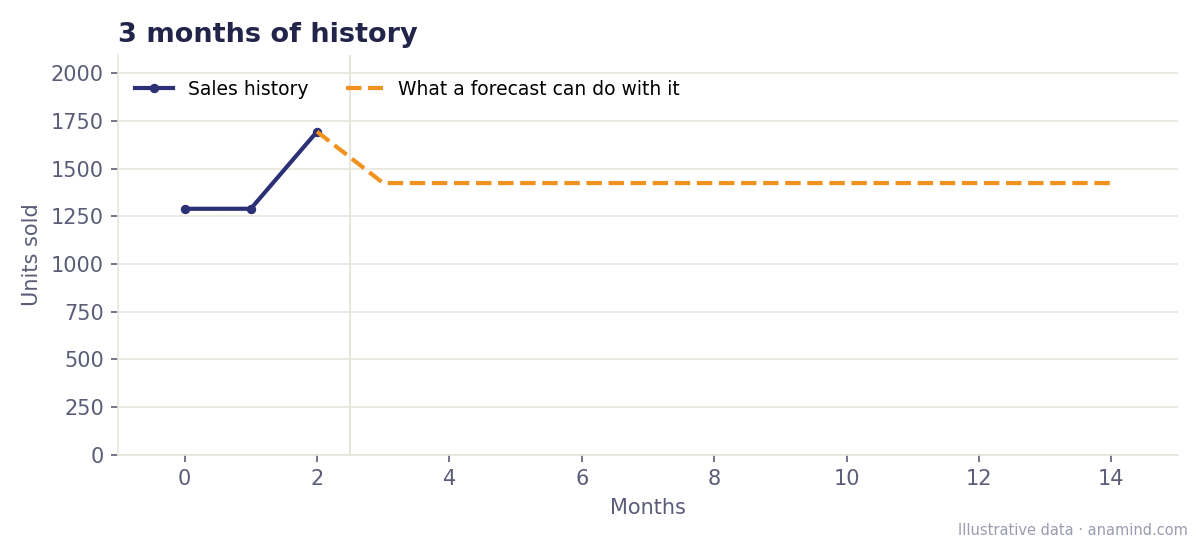
Many companies plan on the average of the last three months, so this can feel like enough. But three months give no clue about direction. All you can do is project the average as a straight line, which can’t tell you whether next month will be high or low, because seasonality isn’t captured. A forecast like this is unreliable and can’t be expected to keep inventory at the right level.
One year of history
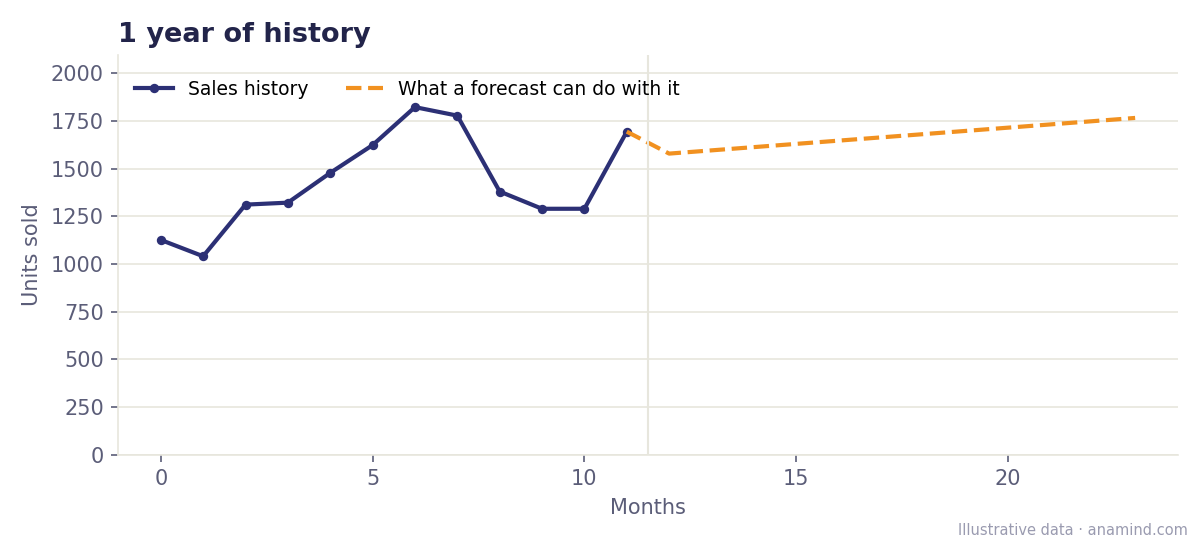
A year of sales data gives better information, but still not enough for a reliable forecast. We can estimate the level and get some indication of the trend, but not seasonality: each month has appeared only once, so a peak could be a season or a one-off. The only way to add a seasonal pattern is to apply business knowledge and adjust the model by hand. Forecasting software won’t detect seasonality in this data automatically.
Adjusting by hand is hard when you have hundreds or thousands of items, which most businesses do. To automate forecasting, a system needs at least two data points for every period: for January, two Januaries from two different years, and so on for each month.
Two years of history: the minimum for seasonality
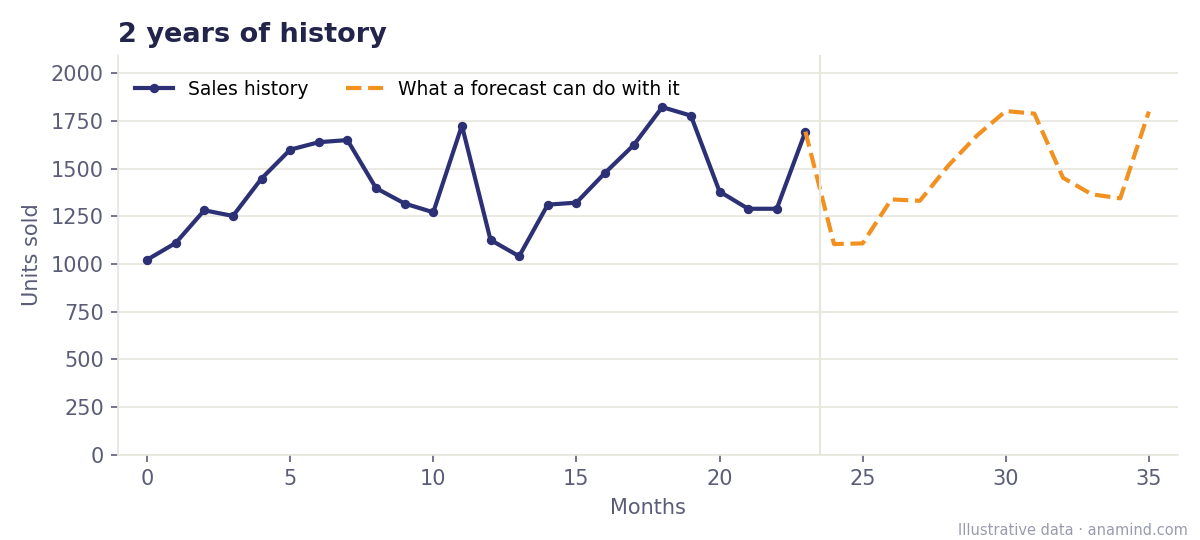
With at least two years of data, a model can separate level, trend and seasonality, and good forecasting software identifies these components automatically. Two years is a minimum, not a comfortable amount. If one of the years had unusual sales because of a promotion, a stockout, a lost customer or a disruption such as a pandemic, the model can mistake that one-off for part of the seasonal pattern. With only two examples of each month, one bad year carries half the weight.
Longer history: three to six years
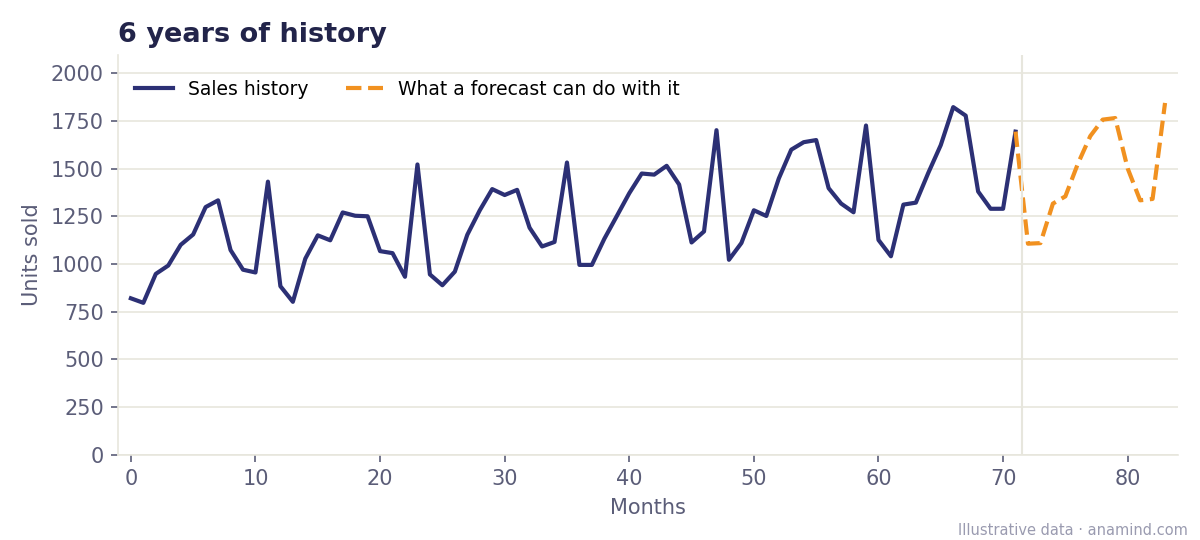
With five or six years of data, patterns are visible even by eye. Level, trend and seasonality are easy to estimate, and the model can also pick up cycles, events and random variation, and separate them from the underlying pattern. More history generally means a more reliable statistical forecast.
How much more than two years is useful depends on your industry and product. In fast-moving technology, going too far back doesn’t help, because the market has changed. For a stable consumer product, a longer history usually gives better results. Know the product’s life cycle, your industry and the economy before deciding how much history to feed the model.
How much data do different forecasting methods need?
| History available | What a model can detect | Suitable methods |
|---|---|---|
| 1–3 months | Current level only | Naive forecast, simple average, plus judgement |
| 4–12 months | Level and a possible trend | Moving average, simple or Holt exponential smoothing |
| 13–23 months | Level, trend and a first view of seasonality | Regression with seasonality, used with care |
| 24–36 months | Level, trend and seasonality | Holt-Winters, seasonal naive, ARIMA-type models |
| 36 months and more | All of the above, plus cycles and event effects | Seasonal models, machine learning, ensembles of several models |
Items that sell only occasionally, such as spare parts or slow movers with many zero months, need a different approach whatever the history length: methods designed for intermittent demand, such as Croston’s method, forecast how often and how much demand occurs separately.
What data is needed for forecasting besides sales history?
The length of history is only half the answer. A model can only learn from what’s in the data, so the events that shaped past sales need to be recorded too:
- Stockouts. When an item was out of stock, sales understate real demand. If those months aren’t flagged or corrected, the model learns that demand was low and the next forecast will be too low as well.
- Promotions and price changes. A promotion spike looks like demand the model should repeat next year. Recording promotion dates and discounts lets it separate the uplift from the baseline.
- Launch periods. A new product or a new store often sells unusually well in its first weeks because of launch promotions. Leave those weeks out of the history, or the model will expect the launch spike to continue.
- Product changes. When a product replaces an older one, link the two, so the new item can start from the old item’s history.
- Known future demand. Tenders, new customers, large one-off orders and listings the sales team already knows about belong on top of the statistical forecast, not buried in it.
- External factors. Weather, economic indicators, search trends and events can explain part of the variation in demand, particularly for seasonal and weather-sensitive products.
- Clean master data. Consistent product codes, locations and customer hierarchies over the whole history, so that sales aren’t split across duplicates.
What if you don’t have two years of data?
Many items won’t have 24 months: new products, new markets, new channels. That doesn’t mean you can’t forecast them:
- Forecast at a higher level. A product family or category usually has more history than a single SKU. Forecast the seasonality at that level and split it down.
- Borrow history from a similar item. A predecessor or a comparable product gives the new item a starting pattern.
- Use simpler models. With 12 months or less, a level-and-trend model is more honest than a seasonal model fitted to a single year.
- Add judgement, and measure it. Planners’ adjustments are necessary when data is short. Track whether they improve accuracy, so you know which ones to keep.
In a nutshell
The more history, the better the statistical forecast. For reliable, automatically generated forecasts you need at least two years. With less, you have to correct the system forecast by choosing suitable models and adjusting them with business and product knowledge. And whatever the length, record the stockouts, promotions and product changes behind the numbers.
In Planamind, Anamind’s AI planning platform, 12 forecasting models compete on every item, from exponential smoothing and Croston for intermittent demand to Holt-Winters, auto-ARIMA and an accuracy-weighted ensemble, and the best fit is selected automatically for the history each item has. If you’d like to see what your own data supports, send us your last 24 months of sales and we’ll run your numbers.
Frequently asked questions
What is the minimum data required for forecasting?
For a statistical forecast that captures seasonality, at least 24 months of history per item, so that every month appears at least twice. With less than 12 months, only the current level and perhaps a trend can be estimated.
Is one year of data enough to forecast?
One year is enough to estimate the level and a rough trend, but not seasonality, because each month appears only once. Seasonal patterns then have to be added from business knowledge or from a product group with longer history.
How much data do you need for ARIMA?
For monthly data with seasonality, a seasonal ARIMA model needs at least two full years, and in practice three or more give far more stable results. Non-seasonal ARIMA can work with less, but short series produce unstable parameters.
Can too much historical data hurt a forecast?
Yes, if the old data no longer reflects how the product sells: after a change in pricing, distribution or technology, very old history can pull the forecast in the wrong direction. Use as much history as is still relevant.
What data is needed for predictions besides sales?
Stockout periods, promotions and price changes, product replacements, known future orders, and where relevant external factors such as weather and economic indicators. Without them, the model can’t tell a one-off event from a repeating pattern.