A best-practice note on modern demand planning
Short answer: driver-based demand planning builds the forecast from a statistical baseline plus a separate, owned layer for each known driver, such as sales opportunities, promotions, launches and external signals, instead of one number a planner corrects by hand.
History plus judgement is no longer a forecast
For decades demand planning rested on two inputs: a statistical model run on sales history, and a planner who corrected it. That worked while history was a fair guide to the future.
It is a poor guide now. Much of what moves demand next quarter is not in last year’s numbers: a promotion that did not run before, a listing the sales team is still negotiating, a launch that will take volume from an existing line, a hotter season, a shift in consumer spending, a surge of interest that shows up in search before it shows up in sales.
When a planning system has only two inputs, all of this lands in the manual override. One typed number carries six different reasons. Nobody can audit it, nobody can measure it, and it is lost at the next cycle.
The principle: build demand from its drivers
Leading planning teams no longer treat the forecast as a prediction to be corrected. They treat it as a construction. The baseline says what would happen if nothing changed, and each known driver is then added as its own explicit, owned and measurable layer.
The drivers fall into two groups. Internal drivers are decisions the business makes. External drivers are conditions it must respond to.
| Driver | Type | Typical owner | The question it answers |
|---|---|---|---|
| Statistical baseline | Foundation | Demand planning | What does history alone suggest? |
| Sales opportunities | Internal | Sales | Which deals are not yet in history, and how likely are they? |
| Promotions | Internal | Marketing and trade | What uplift is planned, and on which dates? |
| New product launches | Internal | Product and category | What will the new item sell, and what will it take from existing lines? |
| Weather | External | Planning, automated | Will the season run hotter, colder or wetter than normal? |
| Macroeconomic indicators | External | Planning, automated | Is consumer spending leading demand up or down? |
| Market and search trends | External | Planning, automated | Is interest rising before sales show it? |
| Planner judgement | Internal | Demand planner | What does the planner know that no data source does? |
What constructed demand looks like
The illustration below shows the Demand view in Planamind for a demonstration company selling beverages and snacks. Each driver has its own row between the baseline and the final forecast.
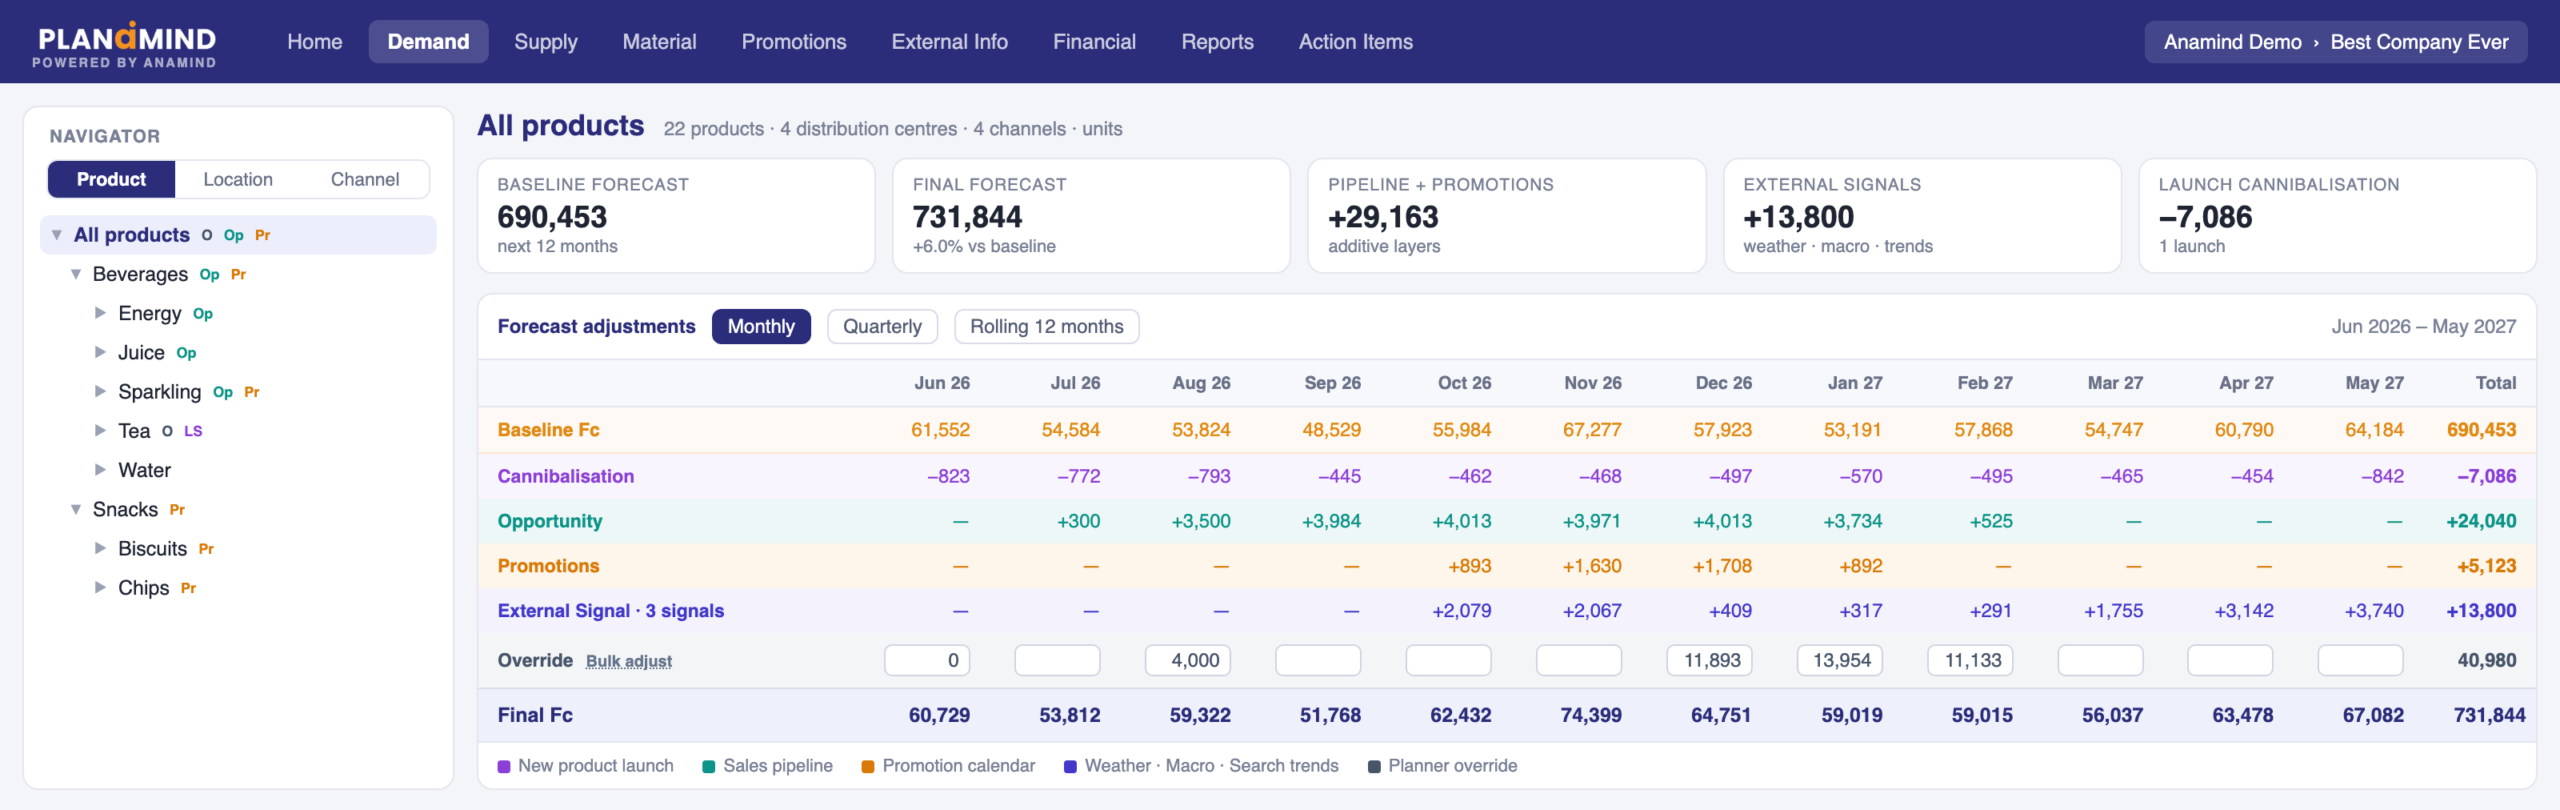
Illustration of the Planamind Demand view at the top of the hierarchy, using demonstration data.
Take November. The baseline is 67,277 units and the final forecast is 74,399. The grid shows where the difference comes from: 3,971 units from the sales pipeline, 1,630 from a Diwali promotion, 2,067 from three external signals, and a reduction of 468 where a new launch takes volume from an existing product.
The forecast is the same single number the supply plan needs. The difference is that every part of it has a name and an owner.
Six practices that separate constructed demand from corrected demand
- Give every driver its own line, in units. If a promotion and a planner’s judgement share one cell, neither can be reviewed. A driver that cannot be seen cannot be challenged or improved.
- Separate what adds from what replaces. A deal or a promotion adds volume on top of the forecast. A signal adjustment or an override restates it. Keeping the two apart lets them stack, so an overridden month still carries its promotion.
- Hold drivers at the lowest level and read them at the highest. Store each one by product, location, channel and month. The same lines should then appear at a category, a region and the whole business, because that is where forecasts are questioned.
- Let the owner of the driver own the input. Sales maintains deals and their stage. Marketing maintains the promotion calendar. When a date or a probability changes, the forecast should move with it, without a planner retyping anything.
- Protect human judgement from automation. An automated adjustment should never overwrite a number a planner entered. Every override should record who made it, when and why.
- Measure each layer and retire what does not earn its place. Compare the accuracy of the statistical forecast with the final one. Compare each promotion’s planned lift with what it delivered. A layer that does not improve the forecast is noise with a label.
A five-minute self-assessment
Ask these of your current planning process:
- If next month’s forecast rose 10%, can you say in units how much came from each cause?
- When a promotion date moves, does the forecast move with it?
- Does a launch automatically reduce the forecast of the product it replaces?
- Can an automated adjustment overwrite a planner’s number?
- Do you know whether last quarter’s overrides made the forecast more accurate or less?
If two or more answers are uncomfortable, demand is still being predicted and corrected, not constructed.
See it in practice
Planamind is built on this model. Its Demand view shows the baseline, sales opportunities, promotions, launch effects, external signals and planner overrides as separate rows, from a single SKU up to the whole business. Planner overrides always take precedence over automated adjustments, and each carries its author and reason.
The quickest way to judge the approach is to see a forecast built this way. Request a demo through our contact form and we will walk you through constructed demand on a portfolio like yours.