Short answer: fragmented planning data means demand, supply and finance each work from their own version of the plan. The cost isn’t the extra spreadsheet work. It’s the decisions that get made late, or made on numbers nobody fully trusts. The fix is to agree one current plan that every function reads from and changes in, with every change and its reason recorded. Getting there doesn’t take a big-bang project. Start with one product family and one monthly cycle, show the value early, then widen it.
What fragmented planning data looks like
You’ll feel it in the week before the monthly review. Demand has a forecast, supply has a view of available stock and finance has a budget snapshot, and each team presents its numbers with confidence. Each is right about its own piece. They just don’t match.
The common signs:
- The first part of every alignment meeting is spent working out whose number is current.
- Finance’s revenue view is built on last month’s forecast, not this month’s.
- Supply plans against a demand figure that sales has already changed.
- Someone keeps a “master” spreadsheet that only they fully understand.
- When a target is missed, nobody can say which assumption changed, or when.
None of this means people aren’t working hard. Usually they’re working very hard to make up for data that doesn’t join up.
Why it costs more than time
The obvious cost is hours spent linking files and reconciling versions. The bigger cost is what happens to decisions.
Decisions drift away from what is actually happening
As a plan passes from demand to supply to finance, each team adds its best estimate based on what it has in front of it. Small differences slip through. A price change goes in late, or stock drifts out of line. Nobody notices until results miss the target or inventory swings, and by then the original assumptions are buried under changes that no single sheet shows.
Finance sees the problem last
When revenue, margin and inventory are tracked in separate places, each figure can look precise on its own while the overall picture is incomplete. A budget move meant to protect margin shifts inventory timing. A supply problem quietly ties up more working capital. Finance owns the P&L but often finds these links only at month-end, after the decision has been made. See demand planning and working capital for how the forecast feeds through to stock and cash.
Accountability gets blurry
If every team has its own numbers, every miss can be put down to “the data”. Teams hedge with their own buffers and meetings become debates about data instead of decisions.
Why more checks and workarounds make it worse
The natural response to data you don’t trust is to add a check: another sign-off, another reconciliation, another person who has to confirm the figures before the meeting. Together they make the cycle longer, and the plan is out of date before it is agreed.
Workarounds do the same thing over a longer period. A one-off report built to fill a gap this quarter becomes part of the process next quarter. New joiners learn the fixes, not the process. Before long, firefighting is simply how planning gets done, and the manual copying between files leaves a weak audit trail.
How to fix it: practical steps
- Map where the plan lives today. List every file, system and report that holds a piece of the plan: forecast, orders, stock, supply parameters, budget. Note who owns each and how often it changes.
- Find the handoffs. Mark each point where data is exported, copied or rekeyed between teams. Those are your main sources of drift and lost audit trail.
- Agree one set of master data. Product, location and customer hierarchies should be the same for every function. If demand plans by brand and finance reports by category, agree how the two map to each other before anything else.
- Put the plan in one place, with one version as the current one. Every function reads and changes the plan in the same place. Scenarios are fine if each is clearly labelled and everyone knows which version is live.
- Record changes where they are made. Every override should carry a reason code and a comment, and the history should be kept. Questions should go to a named person as a comment or task, not into a separate email thread.
- Link volume to value. Turn the supply plan into revenue, cost of goods and gross profit automatically, and compare it with the annual operating plan (AOP). Finance then sees what an operational change does to margin in the same cycle, not a month later.
- Measure the forecast, and the edits made to it. Track forecast accuracy and bias, and check whether manual changes improve the statistical baseline or make it worse. See how to measure forecast bias.
- Remove checks that are no longer needed. Once everyone works from one plan, some reconciliation steps have nothing left to do. Drop them deliberately, or habit will keep them.
If you are still in spreadsheets, our free planning template is a practical way to agree the structure before moving to a platform.
Show value early without skipping governance
It’s tempting to wait until every integration is designed and every requirement signed off. But long projects carry their own risks: requirements move on, business users lose patience, and parallel spreadsheets creep back because people still need to plan in the meantime.
A better approach is to get value early and build from there:
- Start narrow. Pick one business unit or product family with a clear owner and a real planning pain.
- Use the data you already have. Sales history, stock, open orders and the budget usually exist as extracts. Start with those. A full system integration can follow once the process has proved itself.
- Keep checks short and clear. Agree up front what “good” looks like, for example forecast accuracy against a holdout period, one reconciled revenue figure and one agreed plan by a set date. Check against those criteria, not an open-ended list.
- Involve IT early, on the parts that matter. Access control, single sign-on, data residency and audit logs are proper governance questions. Settle them at the start, not at the end.
Checklist: is your planning data fragmented?
- Can demand, supply and finance each name the same current forecast version?
- Do all functions use the same product, location and customer hierarchies?
- Is every manual override recorded with a reason and an owner?
- Can you see the gross-profit effect of a supply plan change in the same cycle?
- Can you explain the gap between the forecast and the AOP by volume, price and mix?
- Do you track forecast accuracy and bias every month?
- Do you know whether planner overrides improve the forecast?
- Could an auditor trace how this month’s plan was built?
- Does your S&OP meeting spend most of its time on decisions rather than reconciling numbers?
More than two or three “no” answers means fragmentation is costing you decisions, not just time.
How Planamind helps
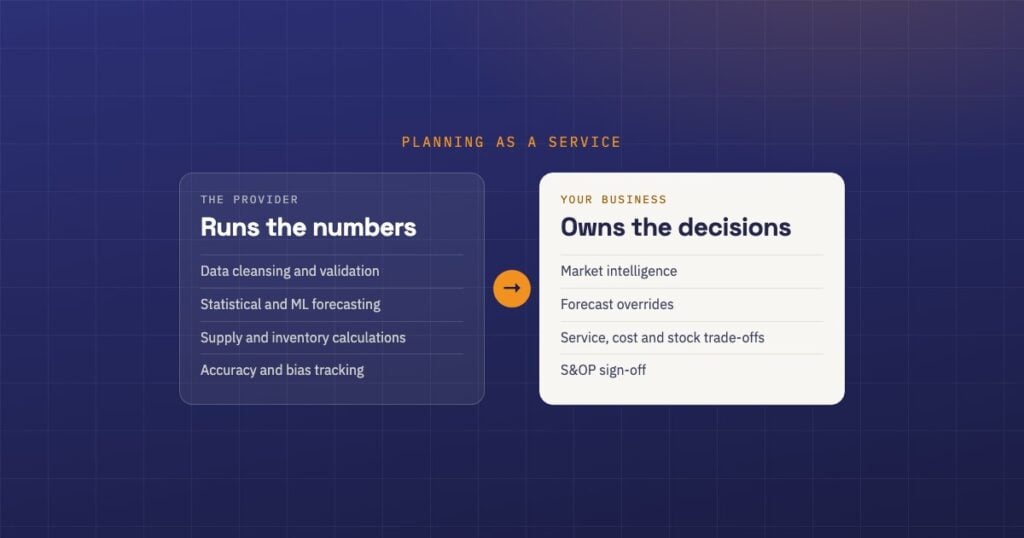
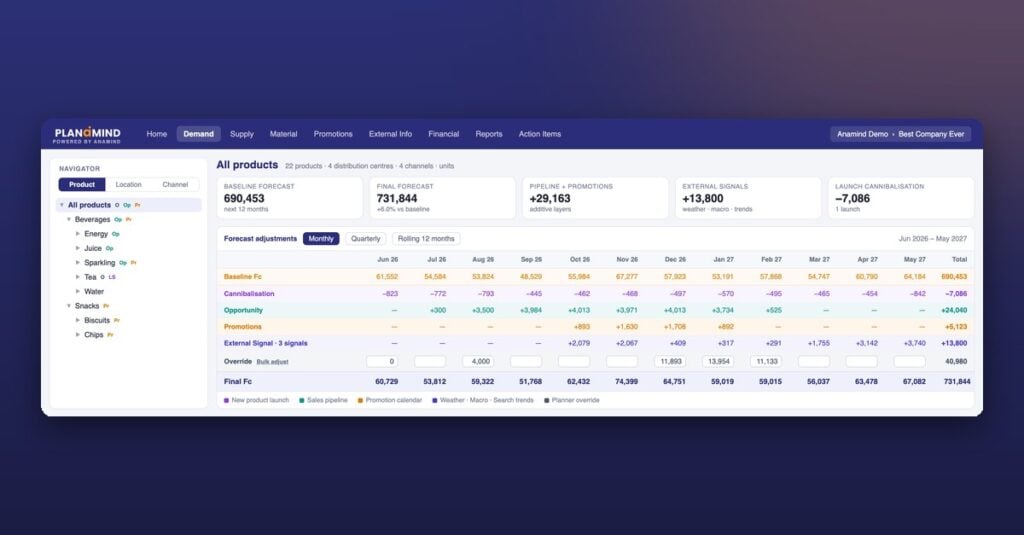
Planamind, from Anamind, puts demand, supply and finance in one plan. The demand planning engine runs 12 forecasting models and picks the best fit automatically. Forecast accuracy (FA%, WAPE, MAPE and bias) and a forecast value added (FVA) report show where overrides help and where they hurt. The supply plan flows into a gross-profit P&L, and a revenue bridge explains the gap to the AOP. Comments, @mentions, tasks, reason codes and override history keep the discussion attached to the numbers (see S&OP collaboration and reporting). Uploads are Excel-shaped, and teams typically go from their data to a first live plan in 48 hours, with full production by Day 30.
Frequently asked questions
What is fragmented planning data?
It’s when the pieces of a business plan, such as the forecast, stock, supply parameters and budget, sit in separate files or systems that are updated at different times by different teams. Each function ends up working from its own version, so decisions are based on numbers that don’t match.
Do we need to replace our ERP to unify planning data?
No. The ERP stays the system of record for transactions. Unified planning means one shared plan built on top of it. Many teams start from regular extracts of sales, stock and orders, and add deeper integration once the process is working.
How do we get finance to trust the operational plan?
Show finance the plan in their terms. Turn volumes into revenue, cost of goods and gross profit, compare them with the AOP, and explain the gap by volume, price and mix. Once finance can trace a margin figure back to the plan behind it, trust comes much more easily.
Where should we start?
Start with one product family and one monthly cycle. Map where the plan lives today, agree shared hierarchies, bring the data into one place and run a live S&OP meeting from it. Then widen the scope based on what you learn.