Short answer: negative values in a demand history are almost never real demand. They are usually returns, cancellations or stock corrections booked in the period they were processed rather than the period the original order belonged to. Left in the series, they drag down the level, distort trend and seasonality, and push every time-series model towards the wrong answer. The fix is to clean the history before you forecast: link each return or correction back to the order and period it relates to, and forecast from that corrected, “forecastable” series.
There is an old expression that applies to any activity that turns input data into actionable information: garbage in, garbage out. It applies just as much to time-series forecasting. Time-series forecasting rests on the idea that a mathematical model which fits the pattern of the history (customer demand or shipments in past periods) can be extended beyond the current period and used as a forecast of demand not yet realised. You can read more about time series here. If the history is faulty, the forecast built on it is likely to be faulty too.
Demand planners today benefit from a great deal of clever work in pattern-fitting models, which use sophisticated mathematics to fit a historical series as closely as possible. Combined with fast computing and tools that quickly find the best-fitting model for any series, these models let planners produce more accurate forecasts than ever before.
However, nothing undermines a forecast model like negative values embedded in the history. When they creep into a time series, they become the bane of most forecasting techniques.
In our earlier article on forecasting intermittent demand, the negative values in the example series were quietly absorbed into the gross average calculated by Croston’s method, and the periods in which they appeared were then ignored when the final forecast was calculated (by spreading total demand over the non-negative observations). This pushes the problem downstream and weakens the forecast. If you are not convinced, take a simple model, such as level exponential smoothing, and calculate the fitted forecast by hand on a series that contains negative values. Watch what happens to the model when it reaches them.
Negative Time-Series Forecasting Values
For this discussion we will use the time series below. It is a screen print from the Planamind statistical model optimisation tool, which evaluates many models and parameters to find the one that best fits the historical observations.

Image source: Planamind
In the intermittent demand article, I split the series into two components: the sub-series of non-positive observations (the red circle in Figure 1 above) and the sub-series of positive demand values (the blue circle in Figure 1 above).
Here I want to focus on the negative observations, marked by the black arrows in the figure. If the series is customer order demand timed by the customer’s requested delivery date, negative values are usually caused by returns in a period that exceed the regular orders for the SKU. If the series is customer shipments, a negative value can be caused by a return on 1 May for an order shipped on 30 April.
My contention is that the demand collection logic should be changed to associate each return with the order it belongs to, in that order’s original time frame. The original demand is then reduced. If a customer buys 100 units in February and returns 40 of them in May, the “real” demand for that customer, product and location is 60 in February (100 − 40).
It is easy to let the demand collection system work the other way, but it is not right: being easy does not make something correct for your organisation. Misattributing returns affects not only the level of demand but also its timing.
How to clean negative values before forecasting
Before any history goes into a forecasting model, it’s worth building a separate forecastable series in which each negative value has been traced to its cause and handled. The common causes, and how to treat them:
- Customer returns. Link the return to the original order (customer, product, location) and reduce demand in the period of that order. If returns can’t be matched line by line, allocate them back over the periods of recent sales in proportion to volume, rather than leaving them in the month they were received.
- Cancellations and order corrections. A cancelled or amended order should change the original order, not create a negative in a later period. Watch for customers who over-order to secure supply and cancel the balance later: they inflate one period and deflate another.
- Stock adjustments and write-offs. Cycle-count corrections, damages, expiries and transfers between locations are inventory movements, not sales. Remove them from the demand history altogether.
- Credit notes and pricing corrections. Value-only corrections sometimes carry a quantity. Exclude them from a unit-based demand series and keep them in the financial records where they belong.
- Genuine data errors. Duplicate postings, wrong units of measure or product codes swapped during a migration. Correct them at source if you can, and document the change if you can’t.
A few rules keep the cleaning honest:
- Don’t simply replace negatives with zero. Zeroing a −40 leaves the original 100 in February untouched, so demand is overstated. It only hides the problem.
- Keep the raw data. Clean a copy used for forecasting and leave the transactional and financial records as they are.
- Log every adjustment. Record what was changed, why and by whom, so the cleaned history can be audited and repeated each month.
- Check the effect. Compare forecast accuracy on the raw and cleaned history over the same periods. Our forecast accuracy template is a simple way to do this.
Conclusion and Further Thoughts
Rather than accept negative values as an unavoidable anomaly, it is worth the effort to re-cast historical demand so that returns and cancellations reduce the period they belong to. The cost of building that association and re-casting the FORECASTABLE series is recovered through better forecast accuracy, which leads to better customer service and less working capital tied up in safety stock. This is not theory: I have worked on improvement projects of this kind that added value far beyond the effort of re-casting the history.
Note that I am talking specifically about the FORECASTABLE time series, not about changing more permanent records in the organisation.
Finally, negative values are not the only problem that can corrupt a forecasting history; they are simply the most obviously wrong. Take a customer who orders several times to secure supply and then cancels the remaining balances once enough has arrived. That inflates demand in one period and may reduce it in a different, incorrect period. The result may not show up as negative values, but both the timing and the level of the customer’s true requirements have been corrupted, and a forecast built on that data will disrupt the very customer it is meant to serve.
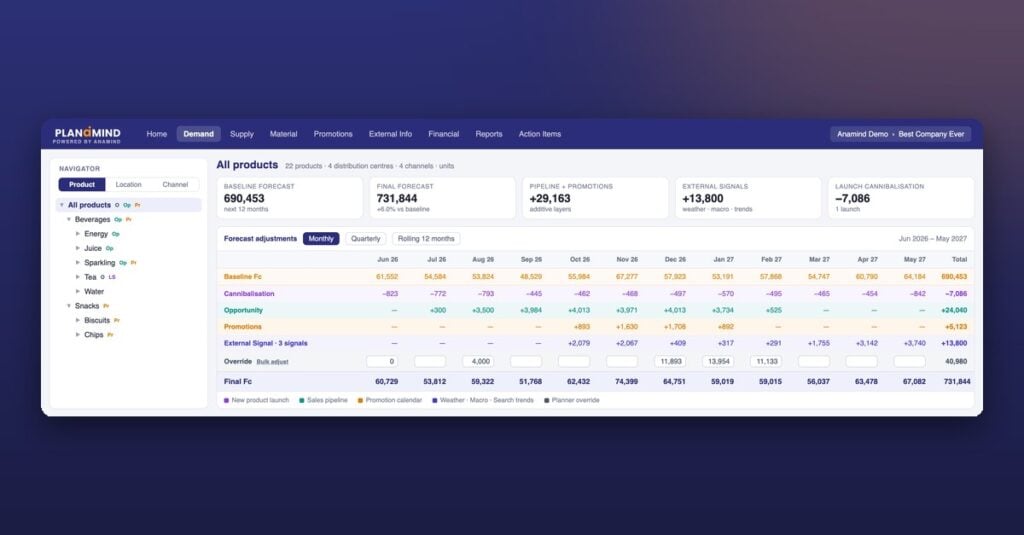
In Planamind, Anamind’s AI planning platform, 12 forecasting models compete on every item, from exponential smoothing and Croston’s method for intermittent demand to Holt-Winters and an accuracy-weighted ensemble, and the best fit is selected automatically. That selection works best on clean history. See how it fits into demand planning software built around your own data.
As always, we would like to hear your thoughts. Have you run into this situation? How did you deal with it, and did it improve customer service? Was an accurate time series worth the journey?
Frequently asked questions
Why do negative values appear in sales history?
Mostly because returns, cancellations, credit notes or stock corrections are posted in the period they were processed. When they exceed the sales in that period, the net figure turns negative, even though customers didn’t “un-buy” anything that month.
Can I just set negative demand values to zero?
It’s better than leaving them in, but it isn’t a fix. Zeroing a negative leaves the original sale untouched, so total demand is overstated. Link the return or cancellation back to the period of the original order where you can, and remove stock adjustments from the demand history entirely.
How do negative values affect forecasting models?
They pull down the estimated level, can create false trends and seasonal dips, and inflate the apparent variability of demand. Methods such as exponential smoothing react to them directly, while intermittent-demand methods such as Croston’s tend to absorb them into averages and hide the problem.
Should I forecast from orders or shipments?
Customer orders, timed by the requested delivery date, are usually closer to true demand, because shipments are affected by stockouts and supply constraints. Whichever you use, clean returns and cancellations in the same way so the series reflects what customers wanted and when.